DATA DESCRIPTION
Download User Guide (PDF)| Years | 1998-2022 |
| 0.0083⁰ (~1km2) | |
| Units | Micrograms per cubic meter of air (μg/m3) |
| Countries | Brazil, Chile, England, India, Ireland, Mexico, Northern Ireland, United States |
| Reference | G. Shaddick et al. (2018). Data integration model for air quality: A hierarchical approach to the global estimation of exposures to ambient air pollution. Journal of the Royal Statistical Society Series C: Applied Statistics. van Donkelaar A. et al. (2021). Monthly Global Estimates of Fine Particulate Matter and Their Uncertainty. Environmental Science & Technology. |
| Source | Atmospheric Composition Analysis Group |
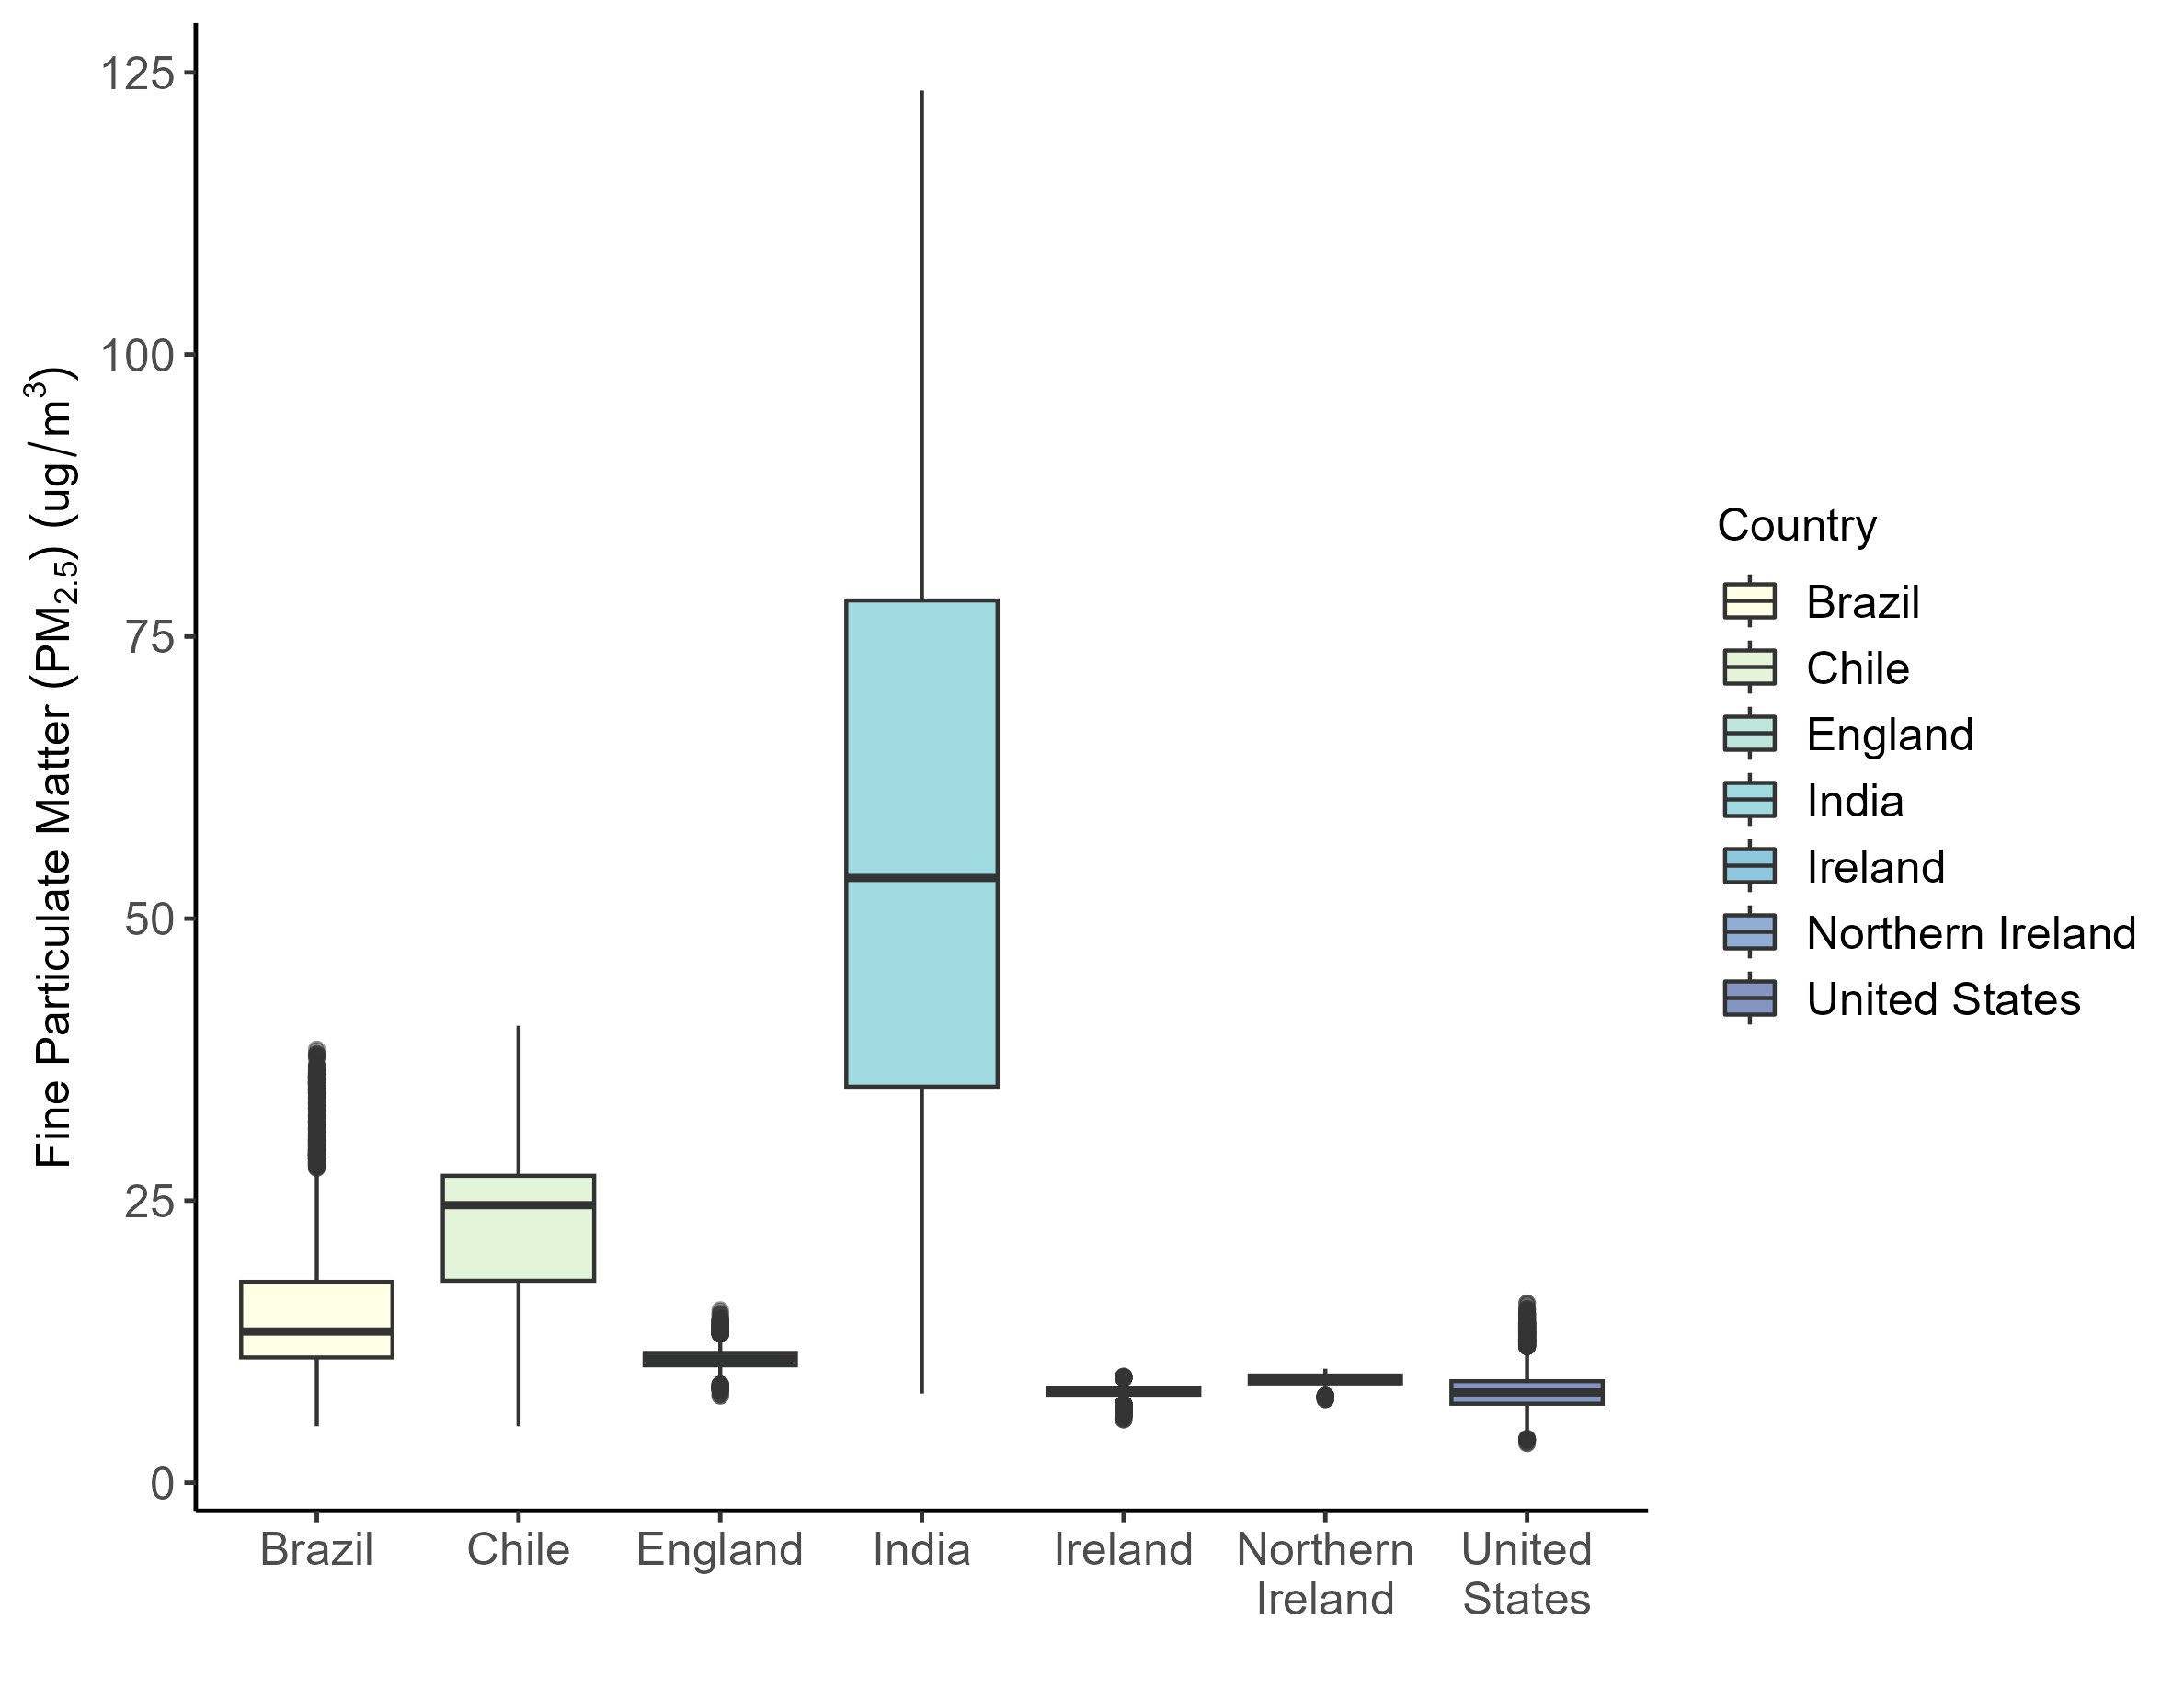
Distribution of PM2.5 by country in 2019
These graphics were generated using a random, population-weighted sample of 10,000 people from each country.
| Years | 2017 |
Resolution | 0.5⁰ x 0.625⁰ (~55km x ~70km) in North America, Europe, and East Asia; 2⁰ x 2.5⁰ (~225km x ~275km) elsewhere |
| Units | Proportion |
| Countries | Brazil, Chile, England, India, Ireland, Mexico, Northern Ireland, United States |
| Reference | E. E. McDuffie et al. (2021). Source sector and fuel contributions to ambient PM2.5 and attributable mortality across multiple spatial scales. Nature Communications. |
| Source | European Organization for Nuclear Research (CERN) |
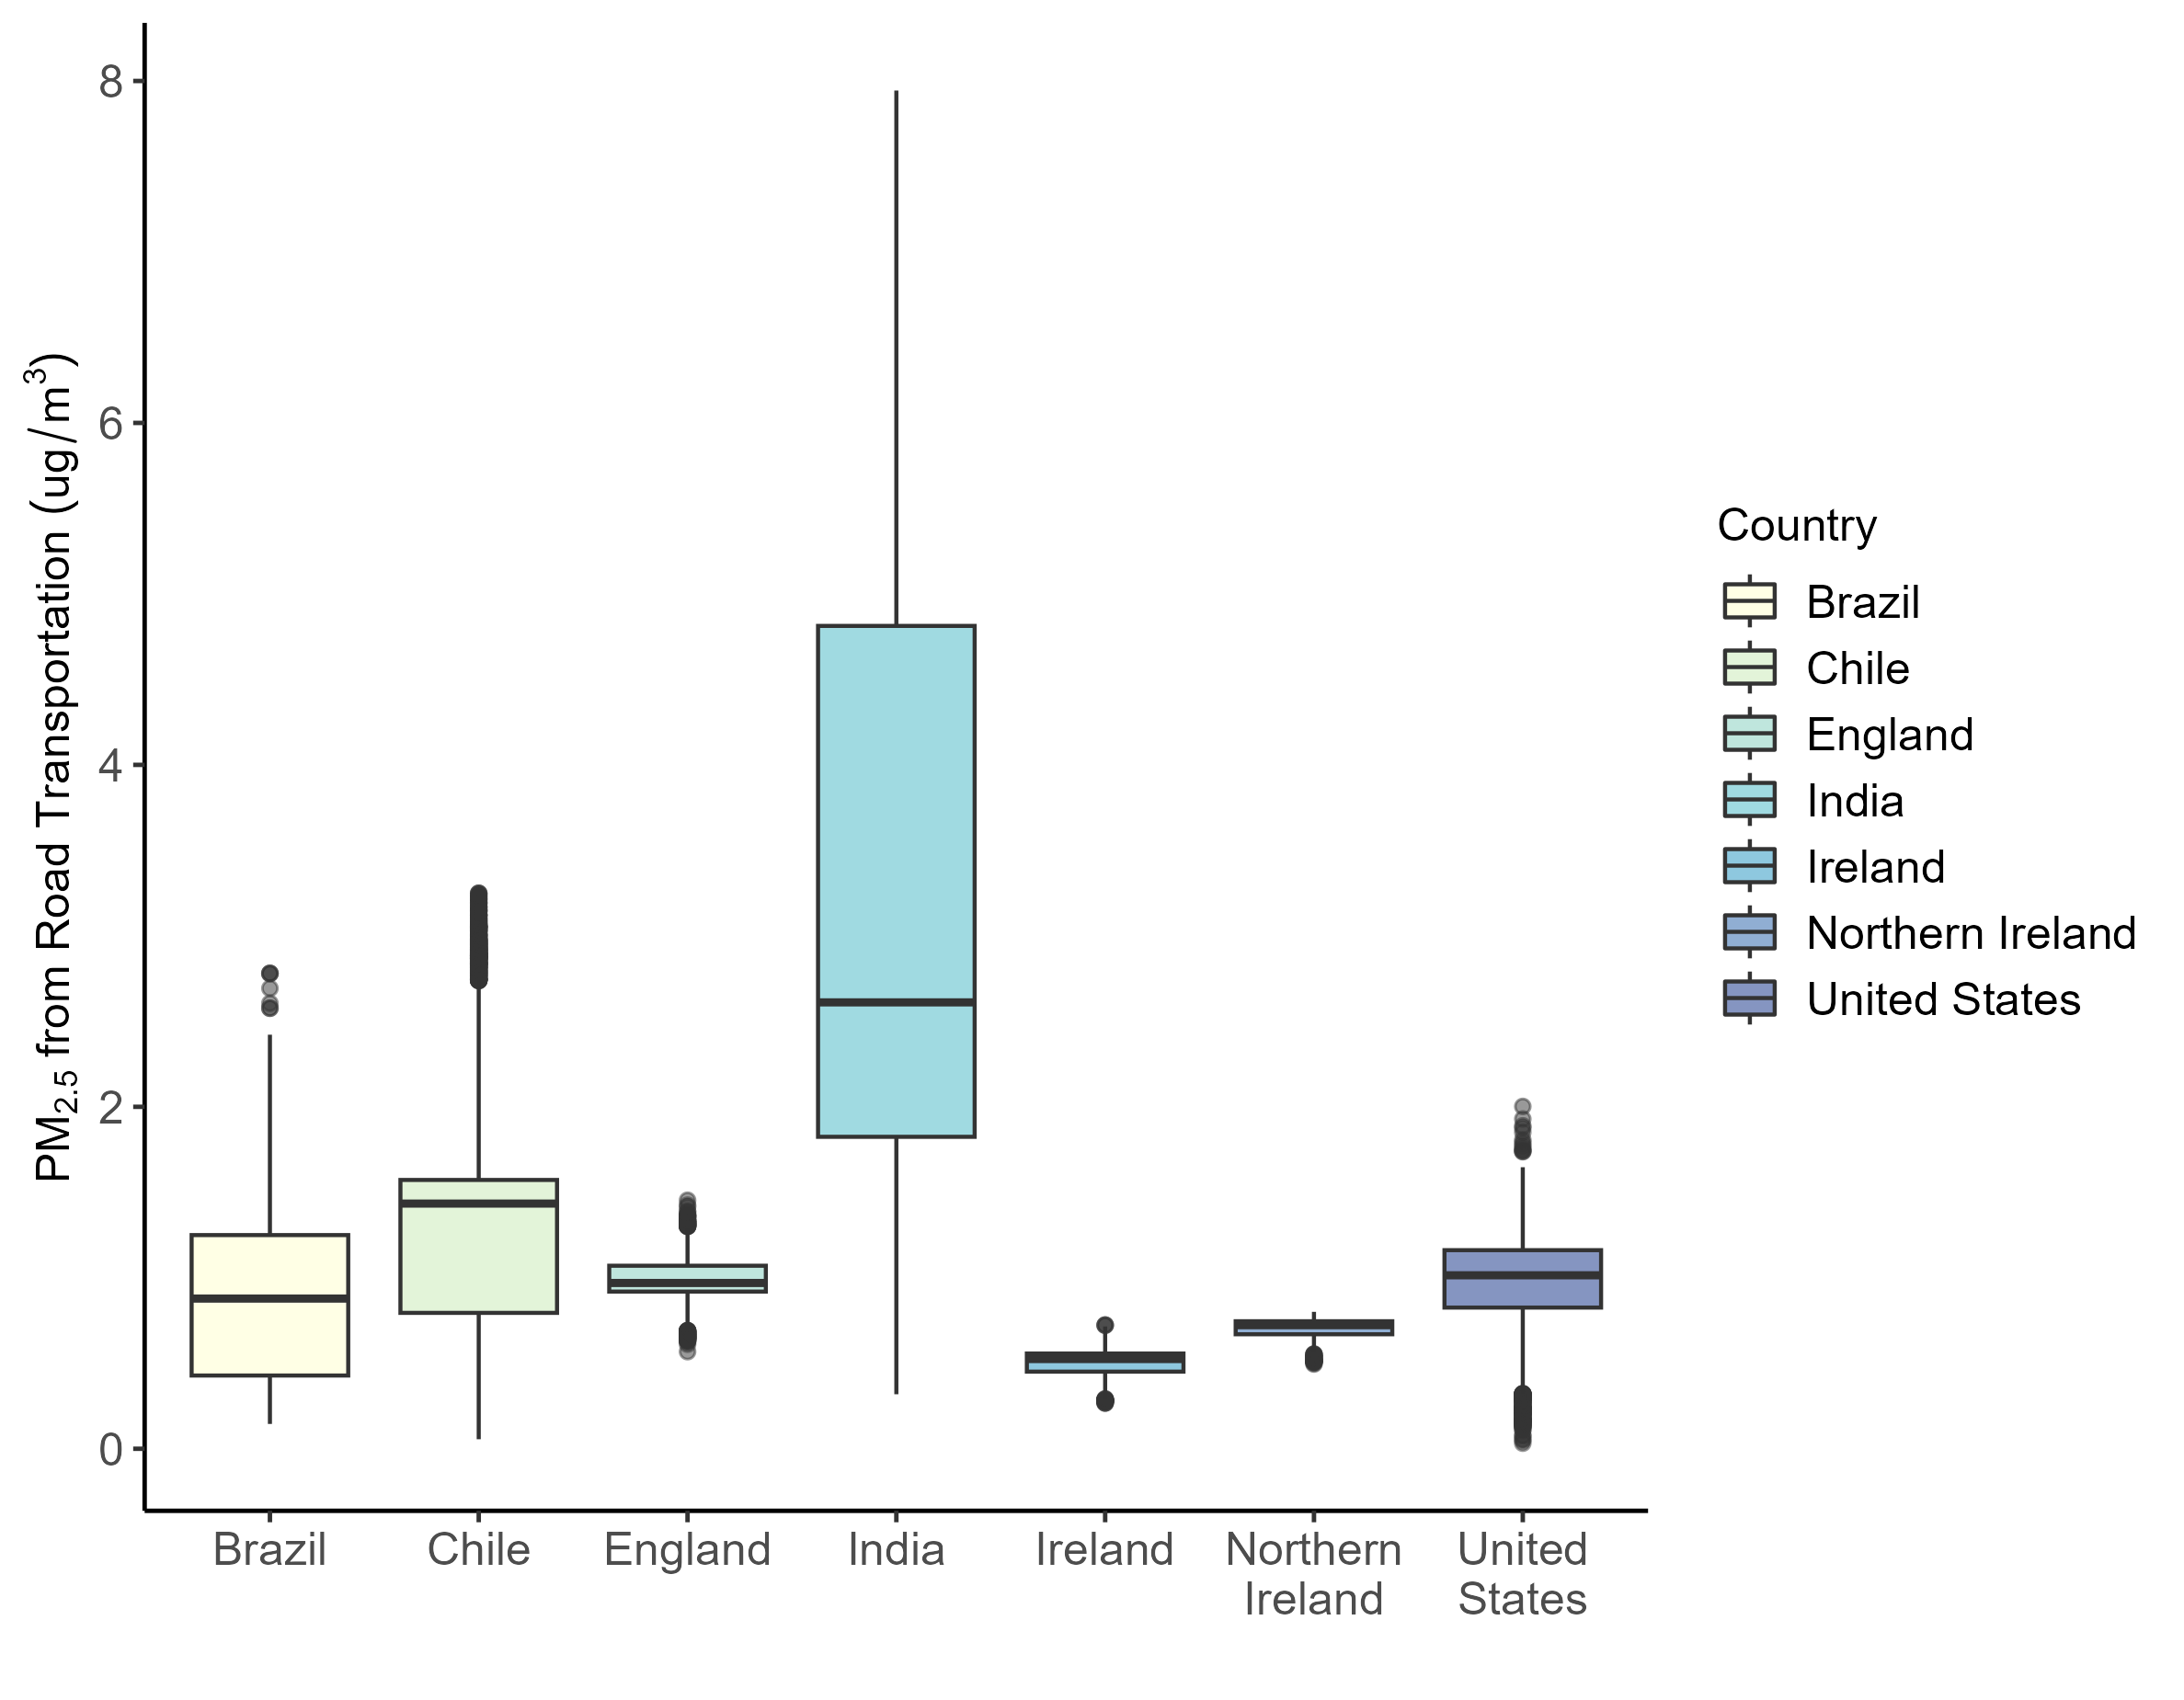
Distribution of PM2.5 from Road Transportation by country in 2017
These graphics were generated using a random, population-weighted sample of 10,000 people from each country.
| Years | 1990,1995,2000,2005-2020 |
| 0.0083⁰ (~1km2) | |
| Units | Parts per billion (ppb) |
| Countries | Brazil, Chile, England, India, Ireland, Mexico, Northern Ireland, United States |
| Reference | S. C. Anenberg et al. (2022). Long-term trends in urban NO2 concentrations and associated paediatric asthma incidence: estimates from global datasets. The Lancet Planetary Health. |
| Source | George Washington University |
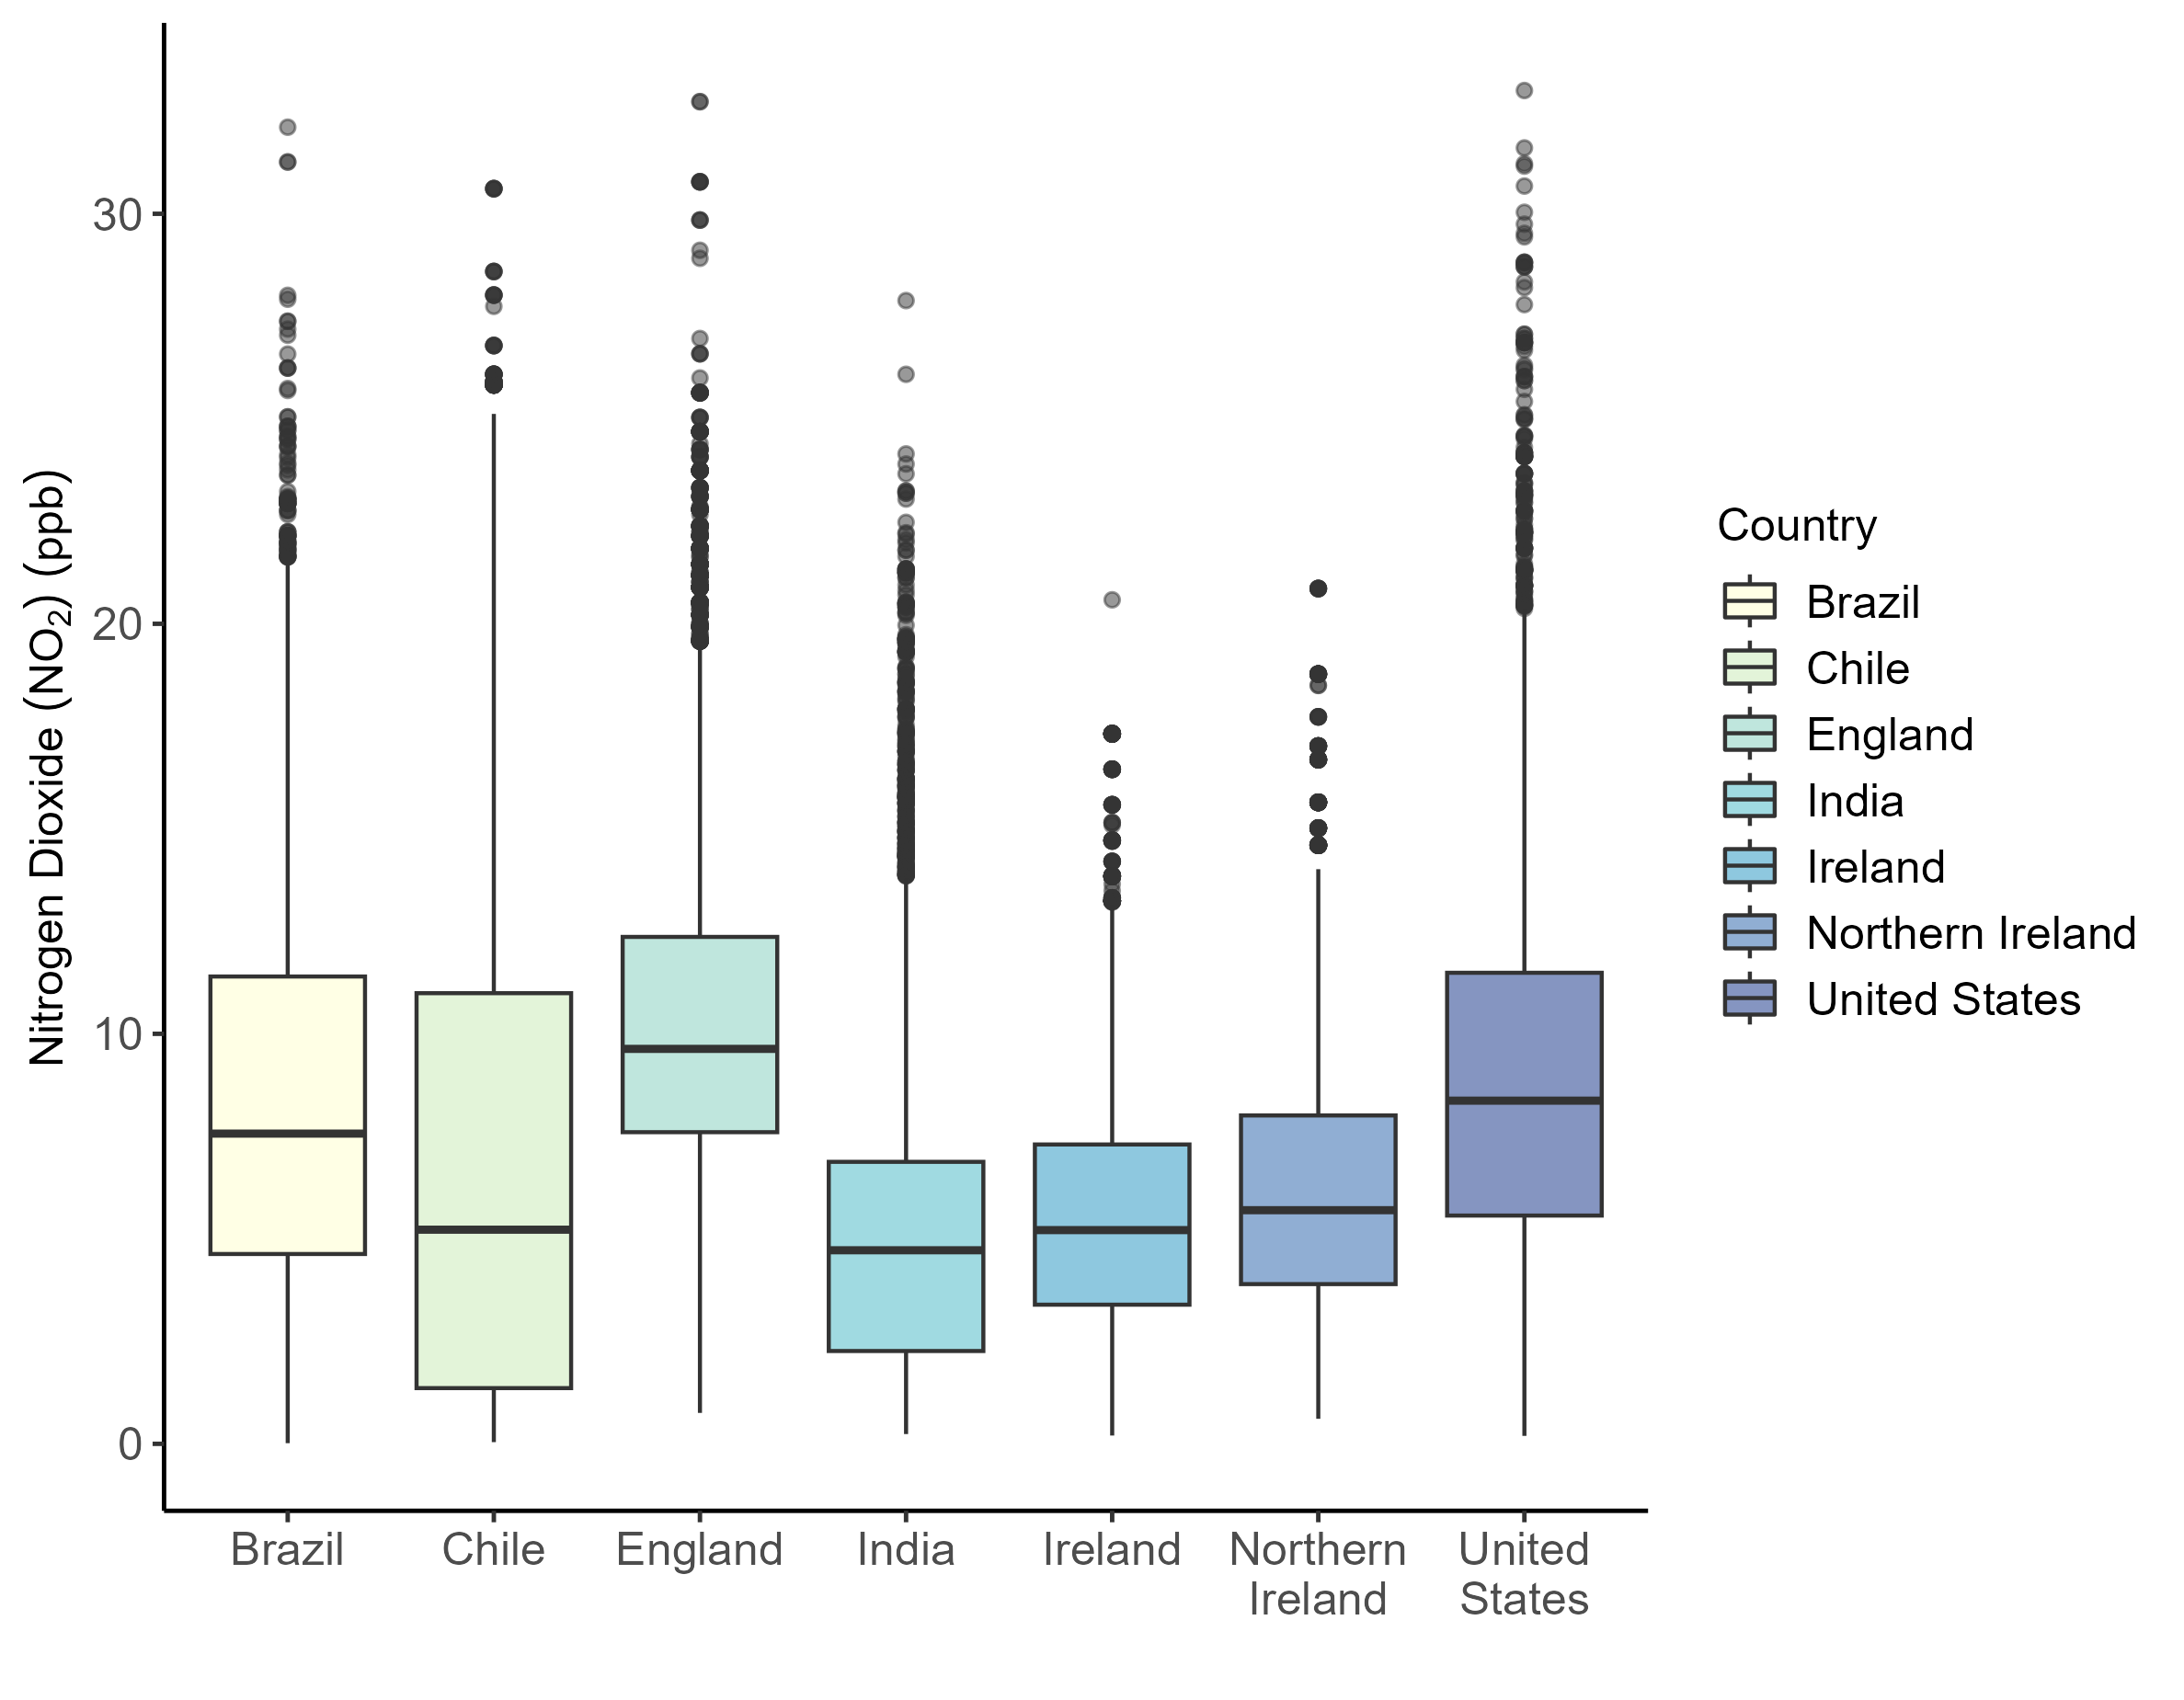
Distribution of NO2 by country in 2020
These graphics were generated using a random, population-weighted sample of 10,000 people from each country.
| Years | 1990-2020 |
| 0.1⁰ (~11km2) | |
| Units | Parts per billion (ppb) |
| Countries | Brazil, Chile, England, India, Ireland, Mexico, Northern Ireland, United States |
| Reference | J. S. Becker et al. (2023). Using regionalized air quality model performance and bayesian maximum entropy data fusion to map global surface ozone concentration. Elementa: Science of the Anthropocene. |
| Source | Jason West at University of North Carolina |
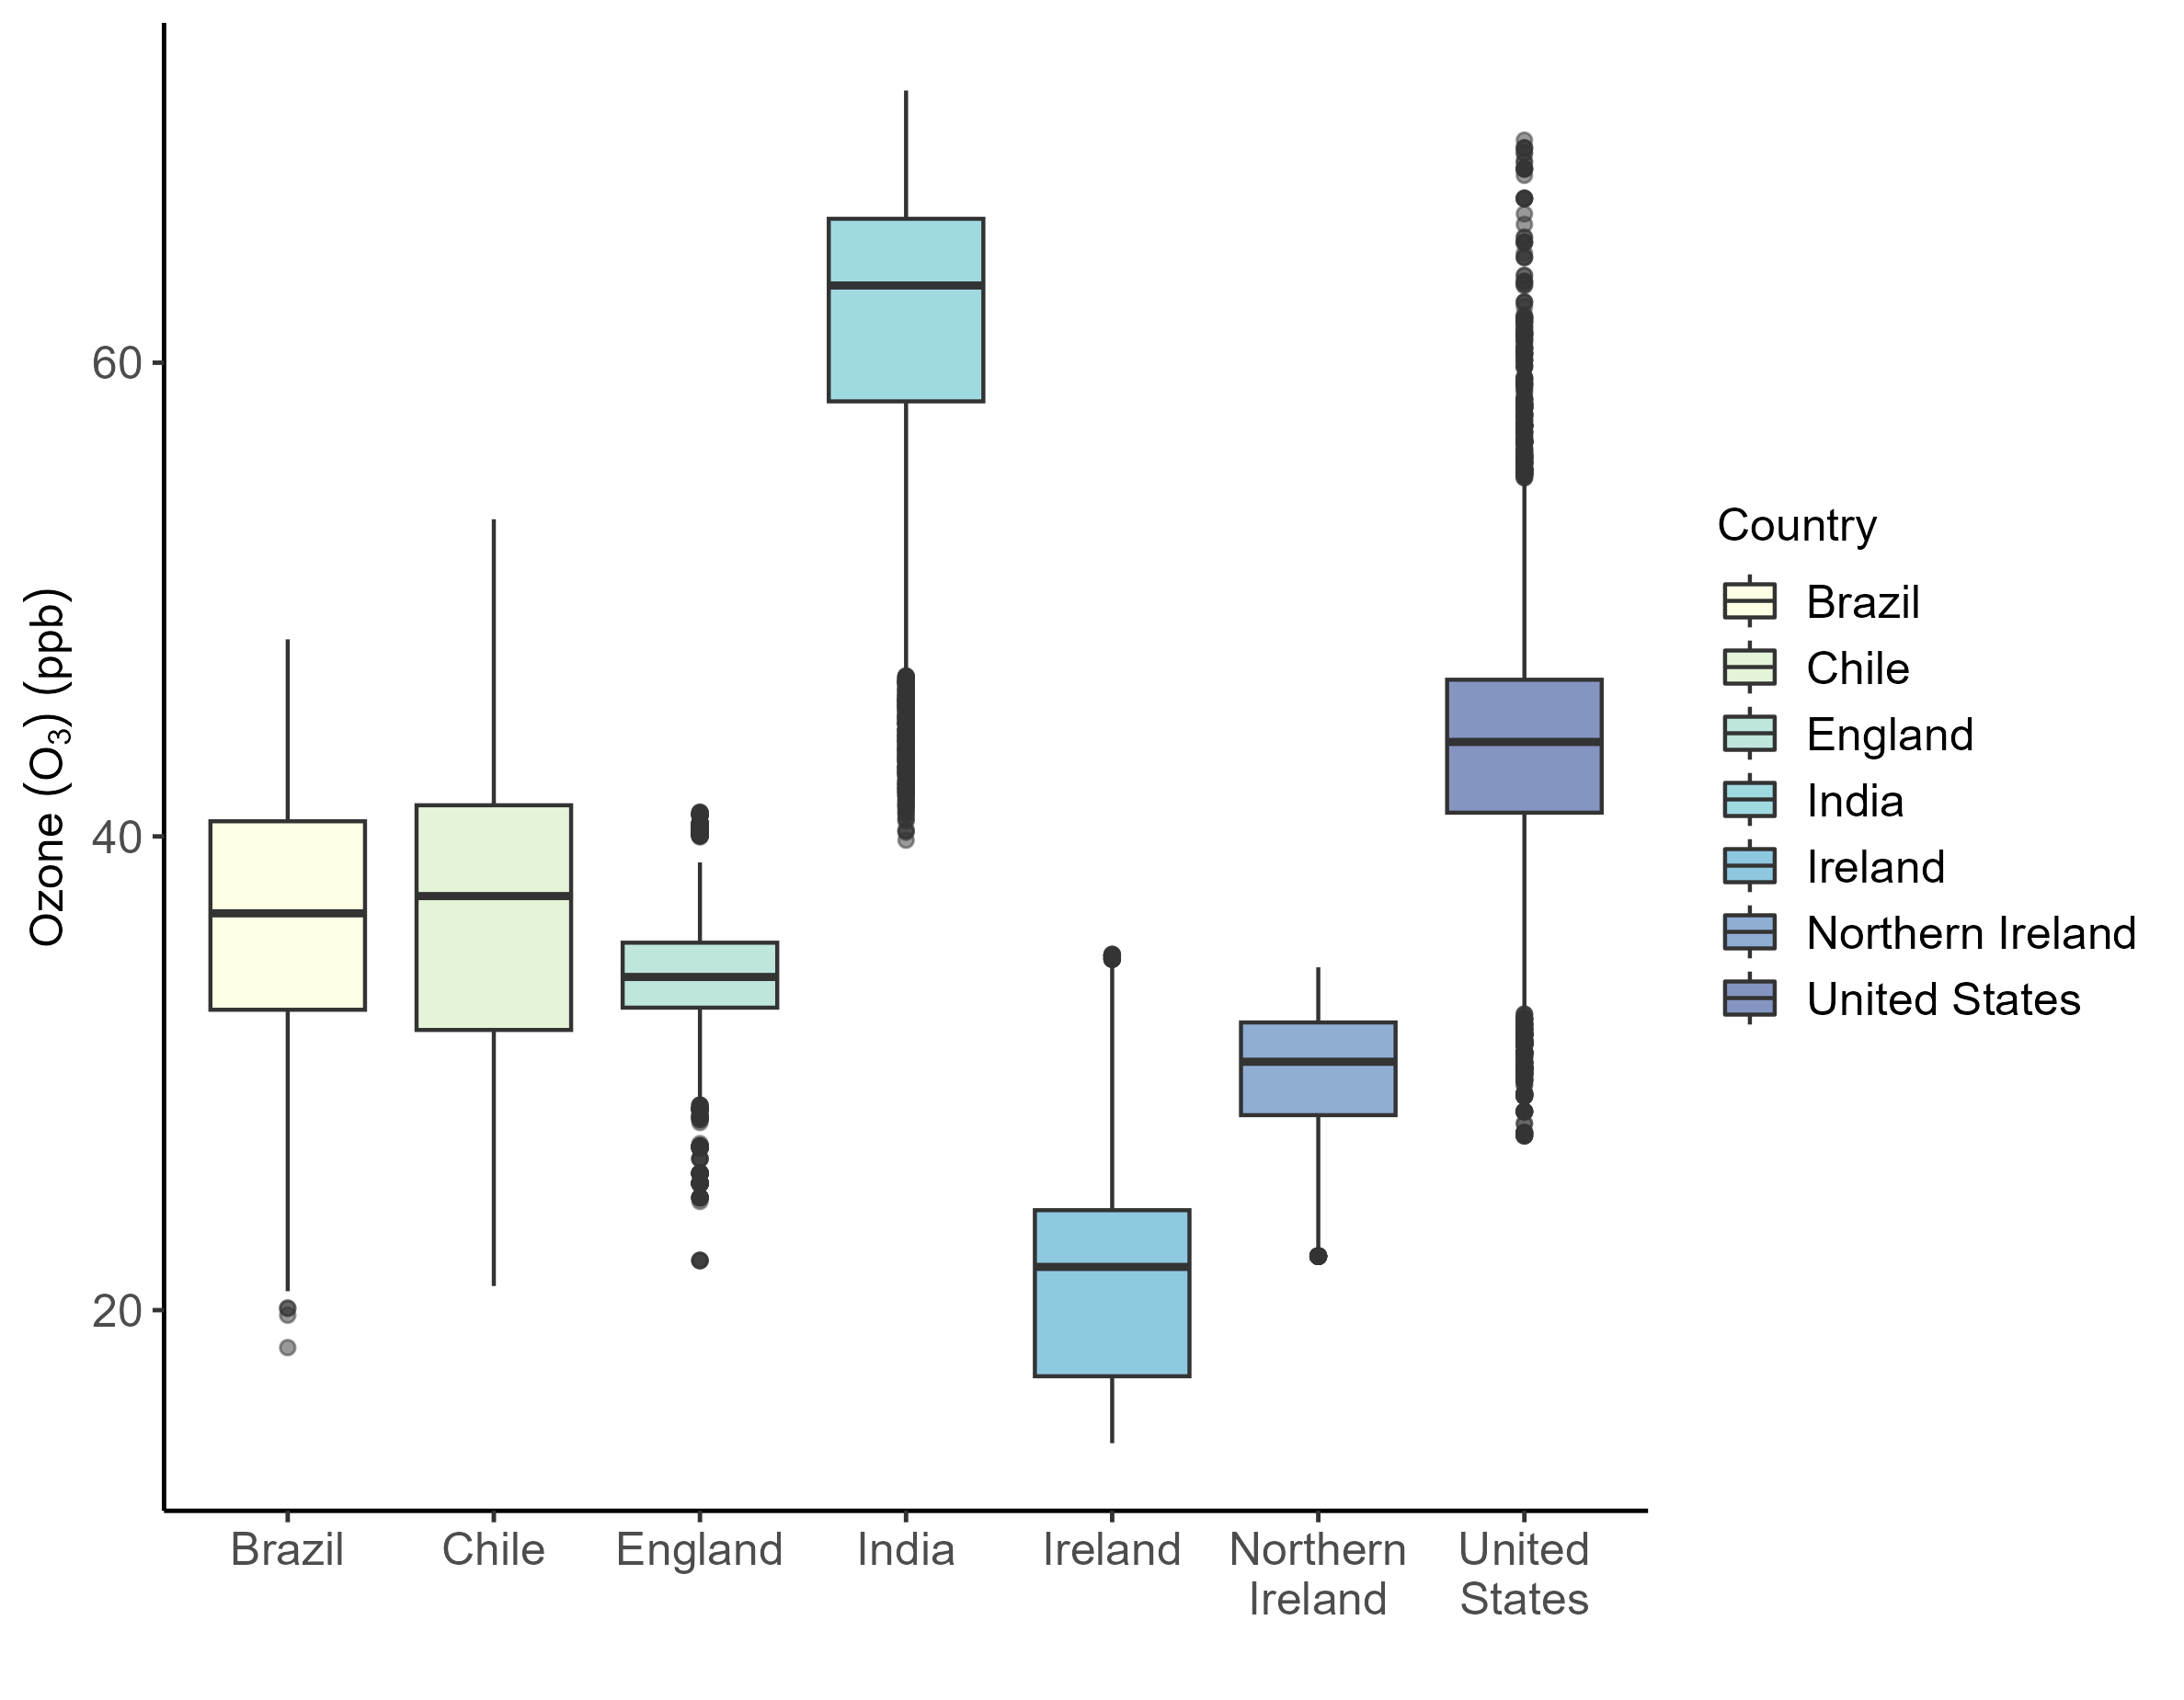
Distribution of O3 by country in 2020
These graphics were generated using a random, population-weighted sample of 10,000 people from each country.
| Years | 2012-2021 |
| 0.0042⁰ (~500m2) | |
| Units | Nanowatts per square centimeter per steradian (nW/cm2/sr) |
| Countries | Brazil, Chile, England, India, Ireland, Mexico, Northern Ireland, United States |
| Reference | C. D. Elvidge et al. (2021). Annual time series of global VIIRS nighttime lights derived from monthly averages: 2012 to 2019. Remote Sensing. |
| Source | Earth Observation Group |
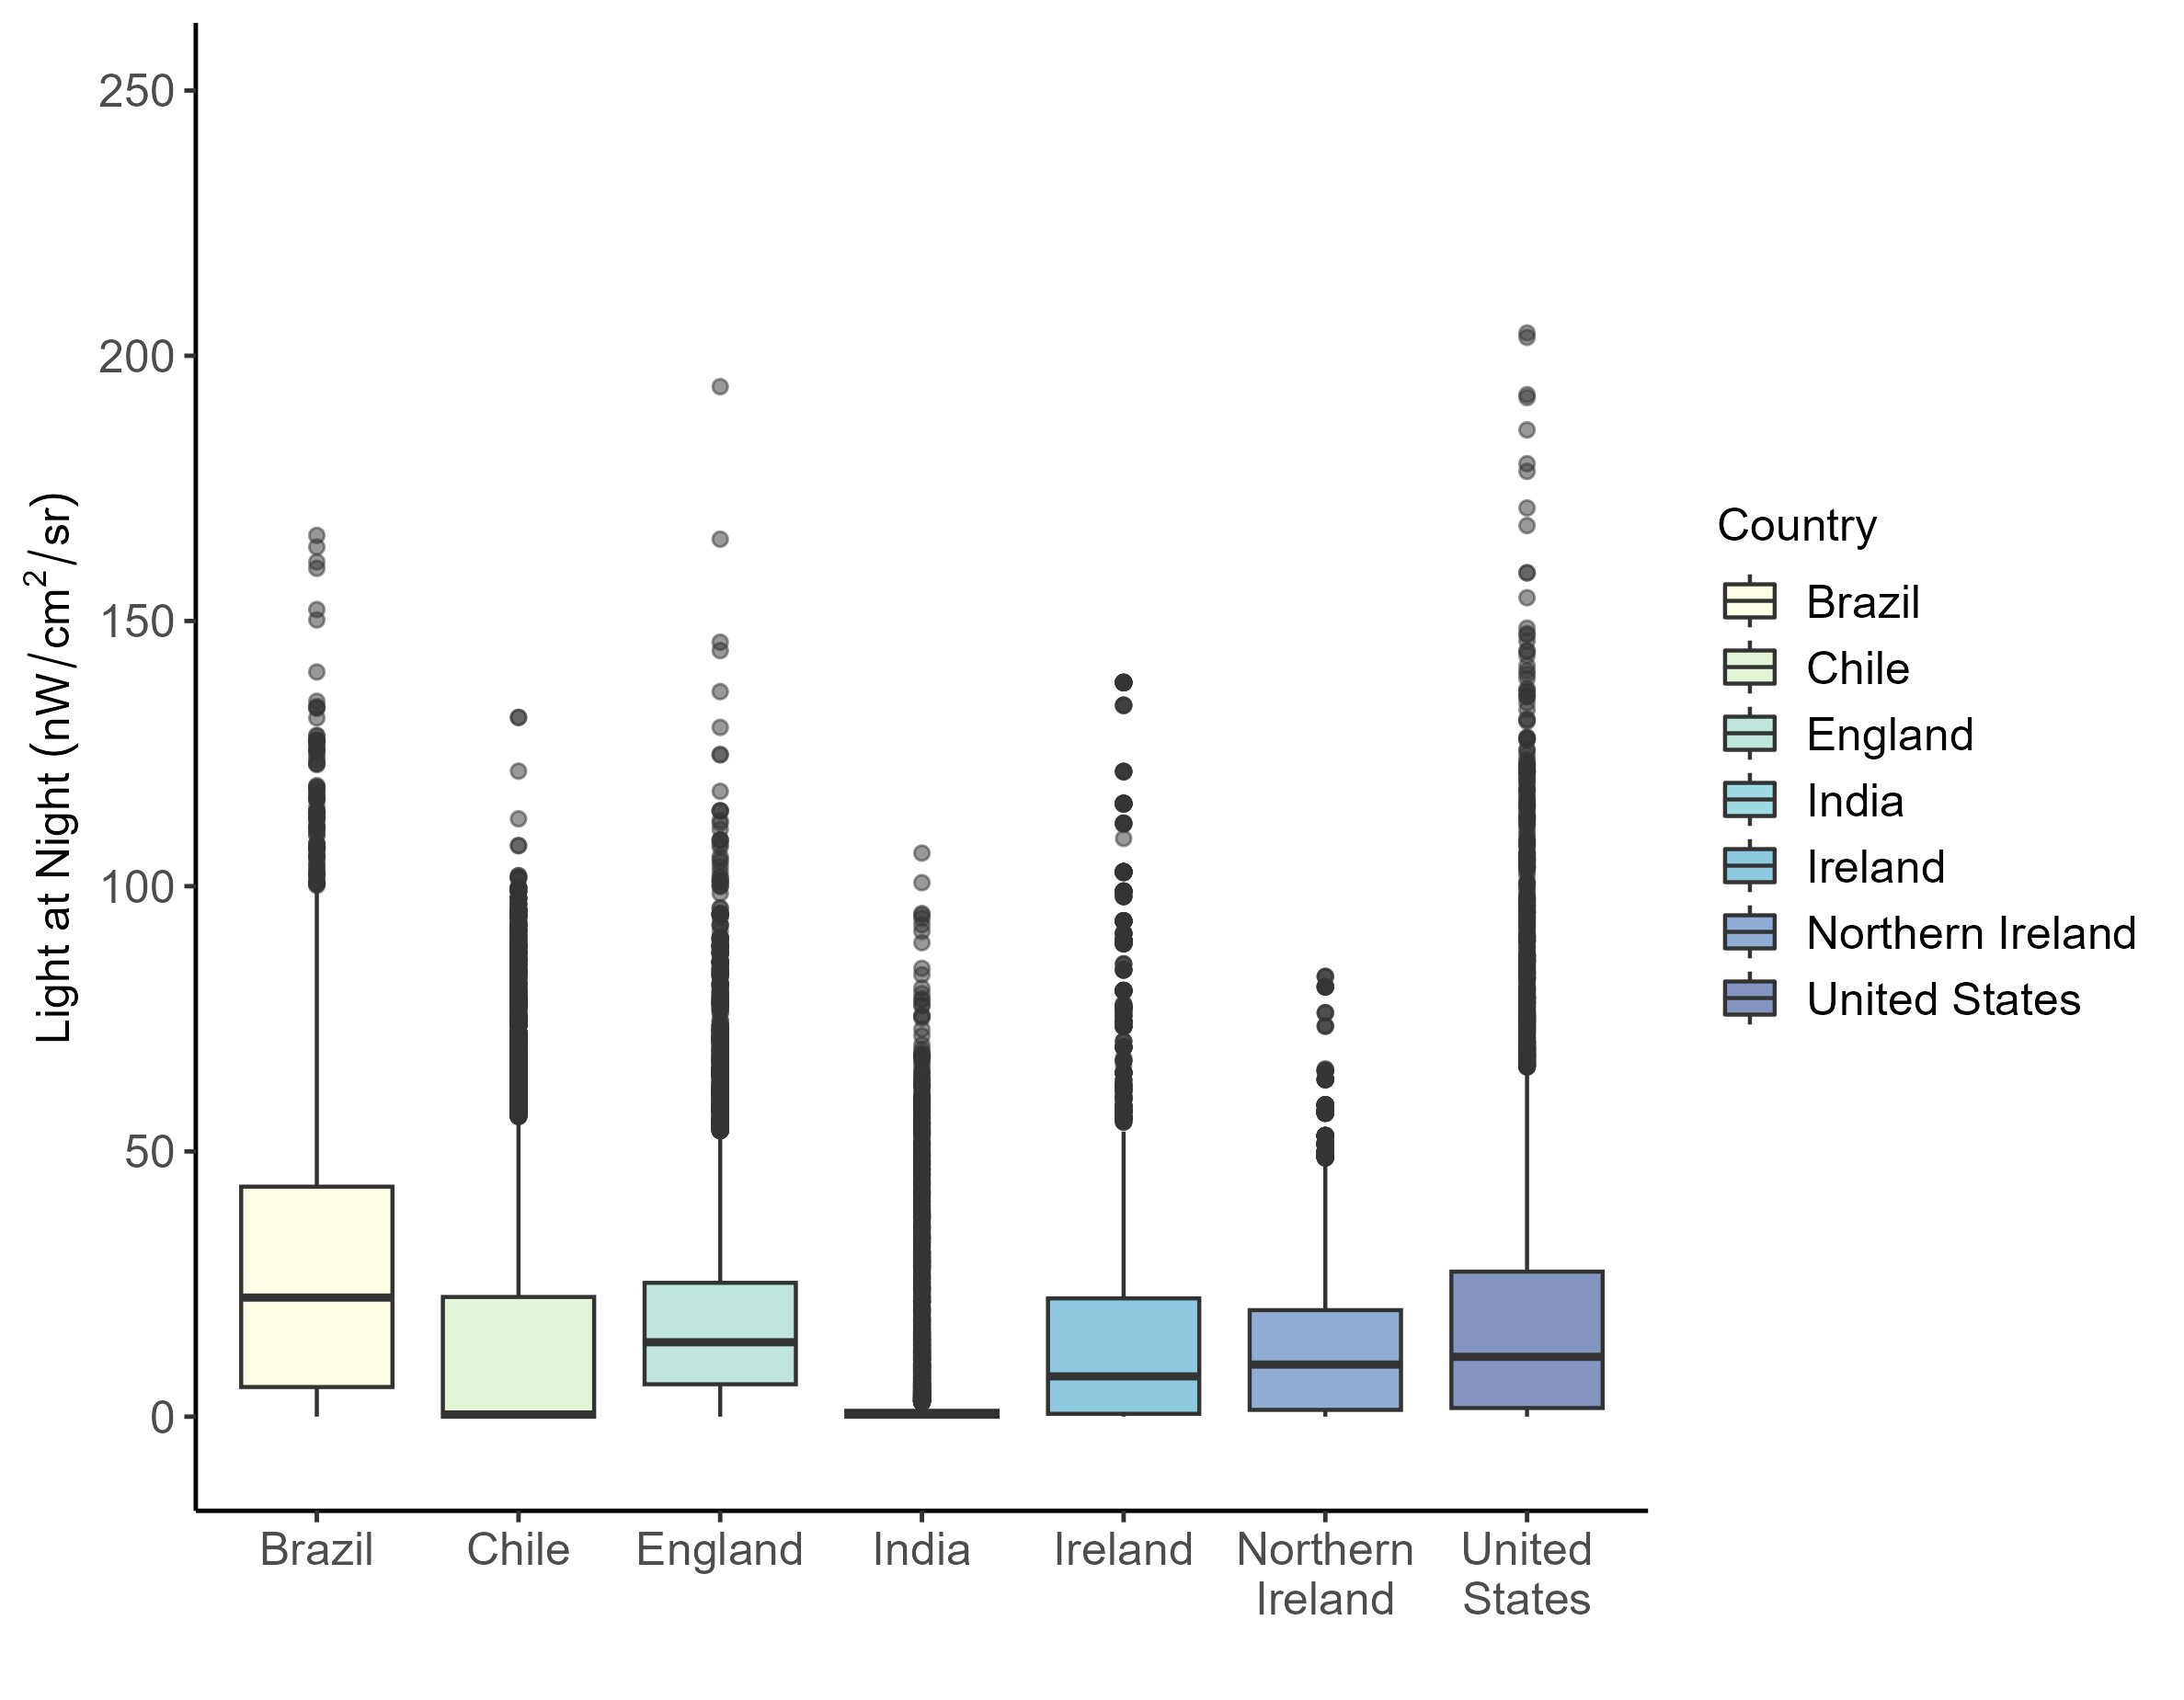
Distribution of Nighttime Light by country in 2021
These graphics were generated using a random, population-weighted sample of 10,000 people from each country.
| Years | 2000-2021 |
| 250 meters (0.06 km2) | |
| Units | Indexed (-1 to +1) |
| Countries | Brazil, Chile, England, India, Ireland, Mexico, Northern Ireland, United States |
| Reference | Didan, K. et al. (2015). MODIS vegetation index user’s guide (MOD13 series v006). |
| Source | U.S. Geological Survey |
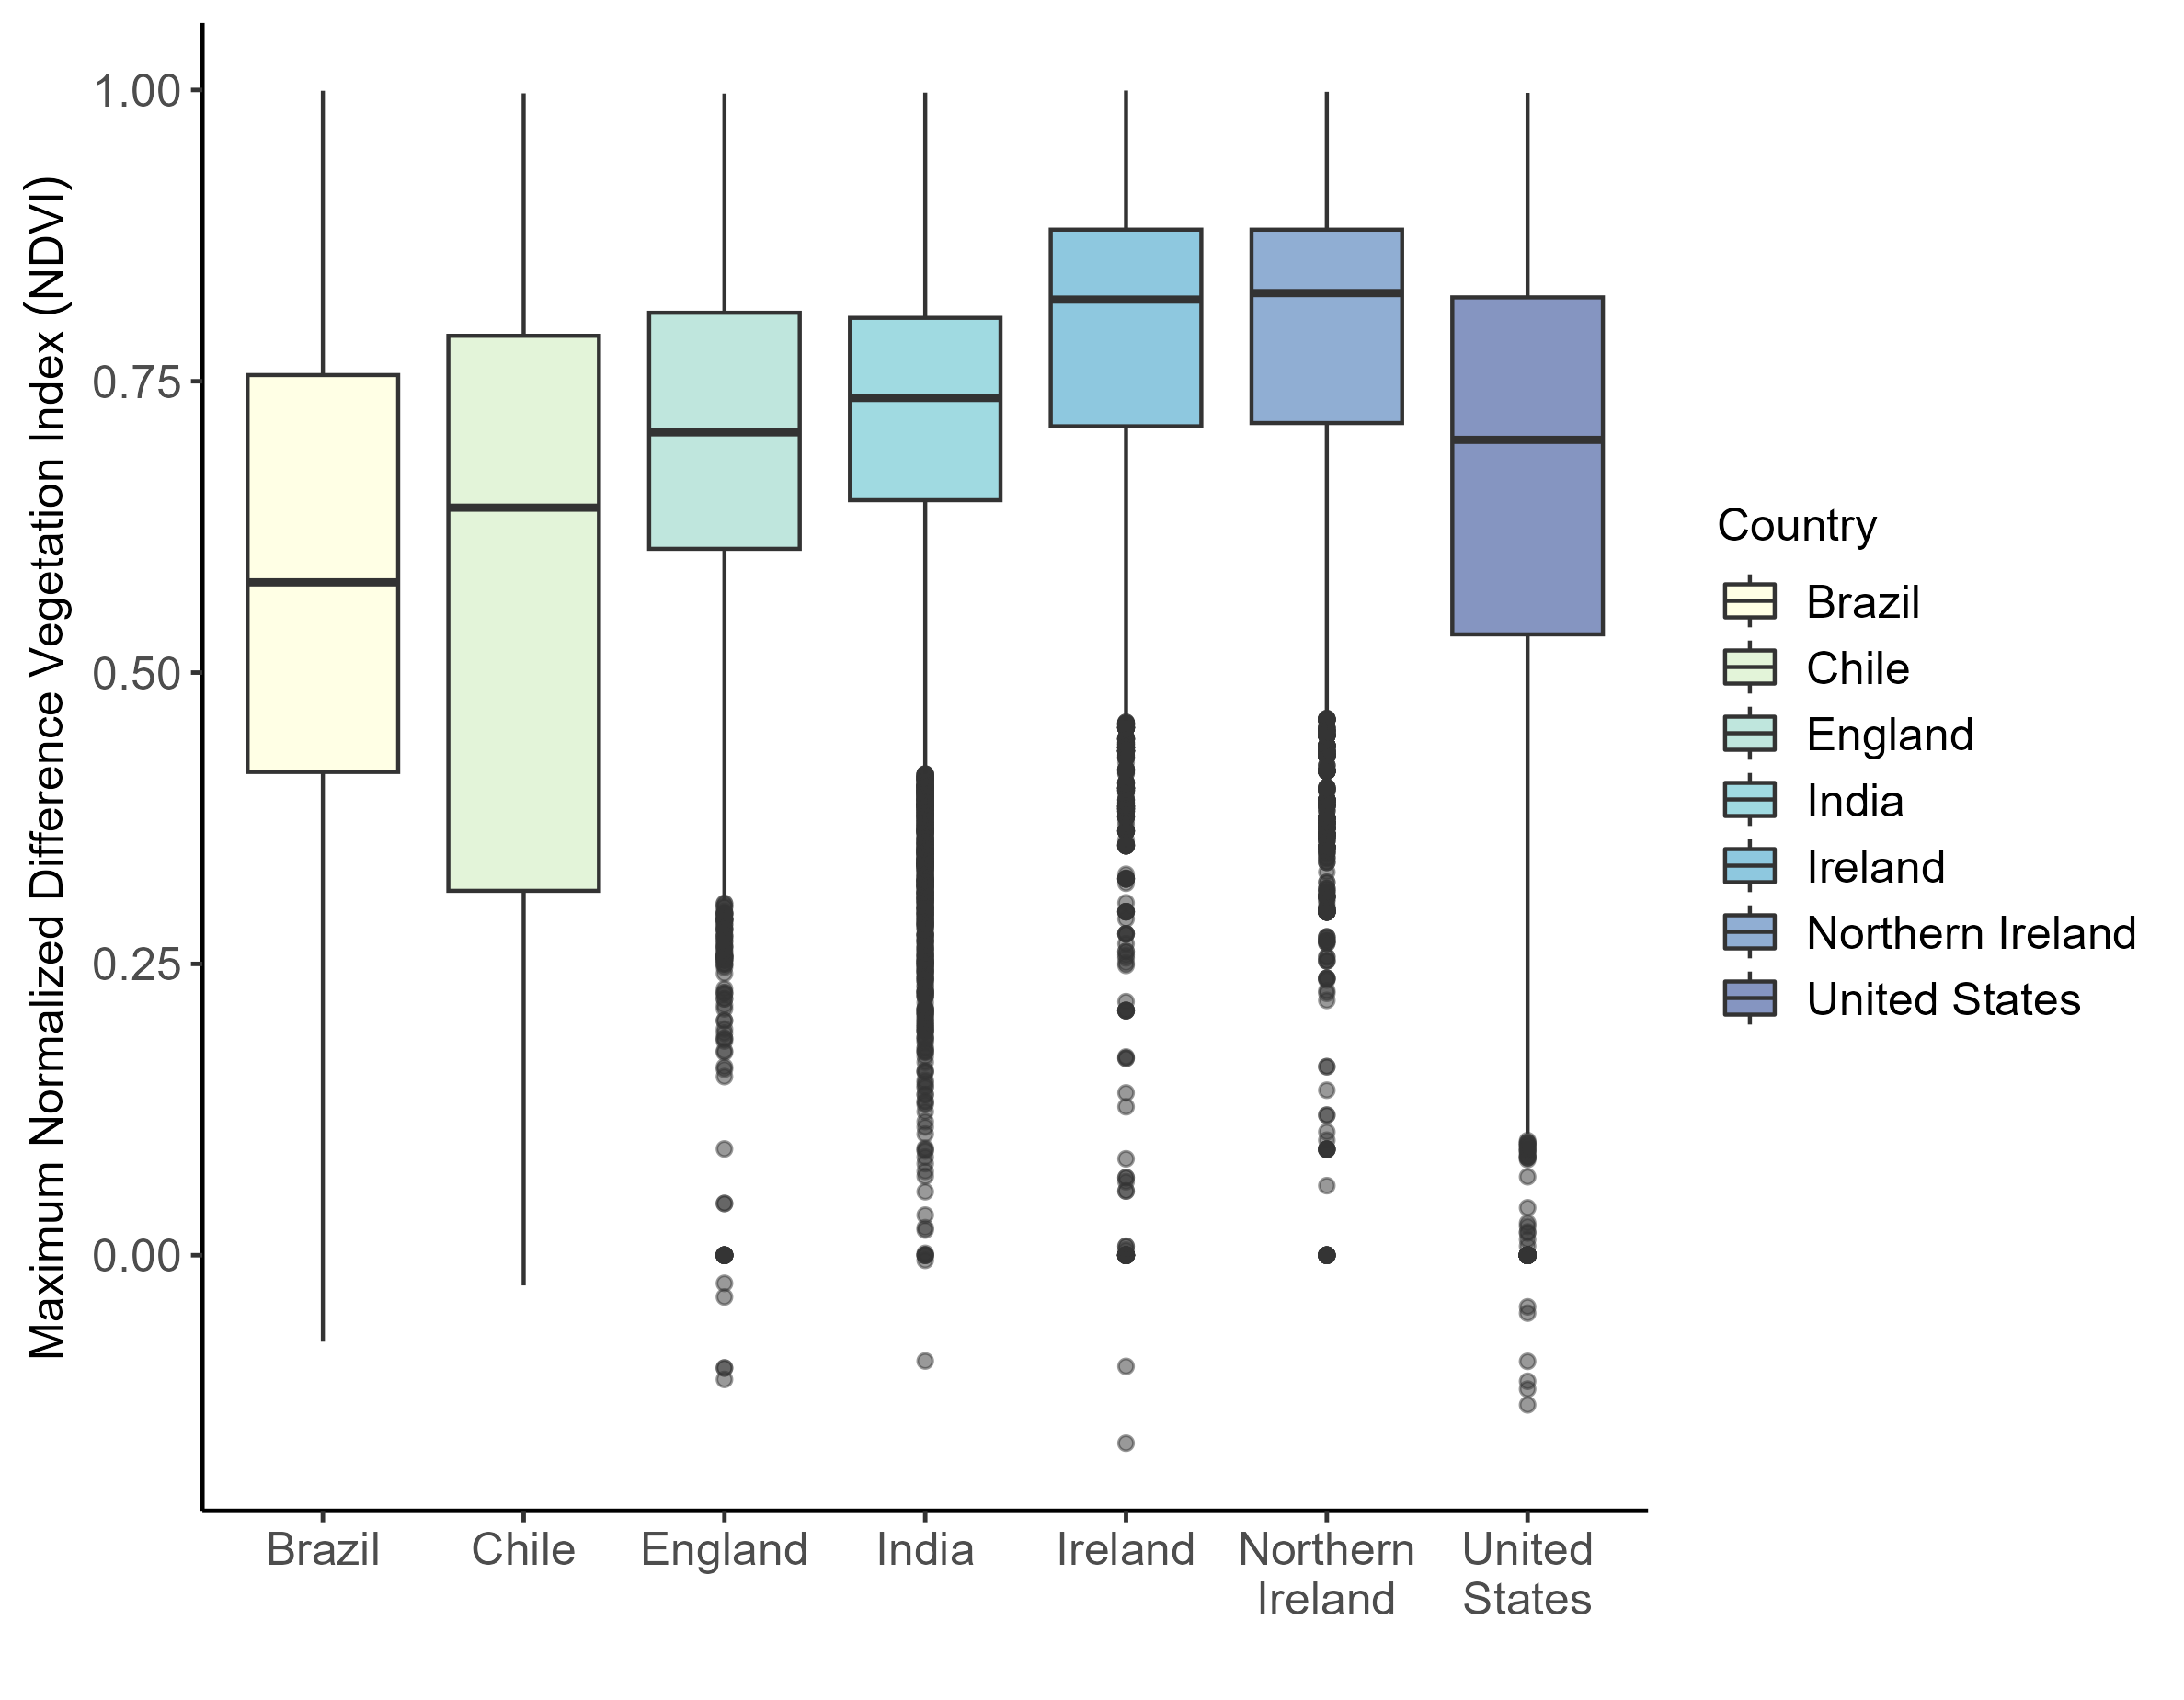
Distribution of NDVI by country in 2021
These graphics were generated using a random, population-weighted sample of 10,000 people from each country.
| Years | 2000-2012 |
| 150 meters (0.02 km2) | |
| Units | Unitless |
| Countries | Brazil, Chile, England, India, Ireland, Mexico, Northern Ireland, United States |
| Reference | Lamarche, C. et al. (2017). Compilation and validation of SAR and optical data products for a complete and global map of inland/ocean water tailored to the climate modeling community. Remote Sensing. |
| Source | ESA Climate Change Initiative |
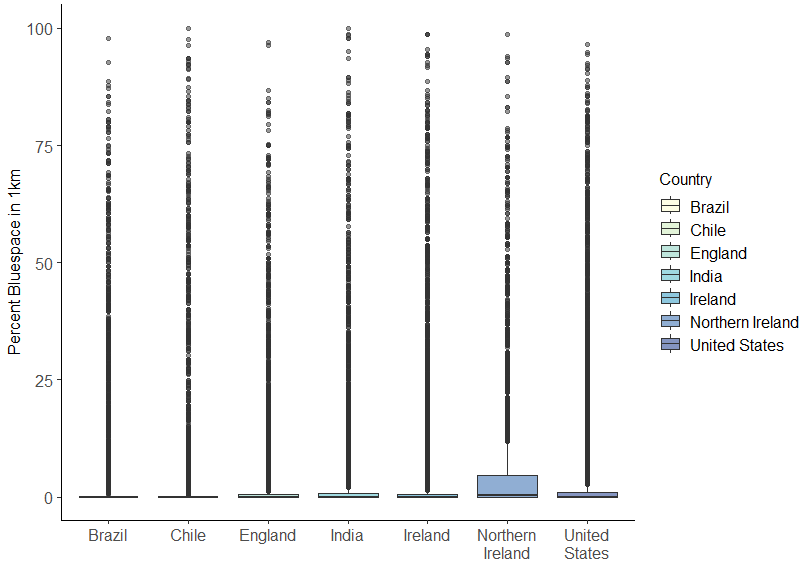
Distribution of Blue Space by country in 2000
These graphics were generated using a random, population-weighted sample of 10,000 people from each country.